A colorful satellite map can make a landscape look easy to understand. One area appears different from its surroundings; another changes sharply between years. The harder question comes next: what happened on the ground, and what evidence would confirm it?
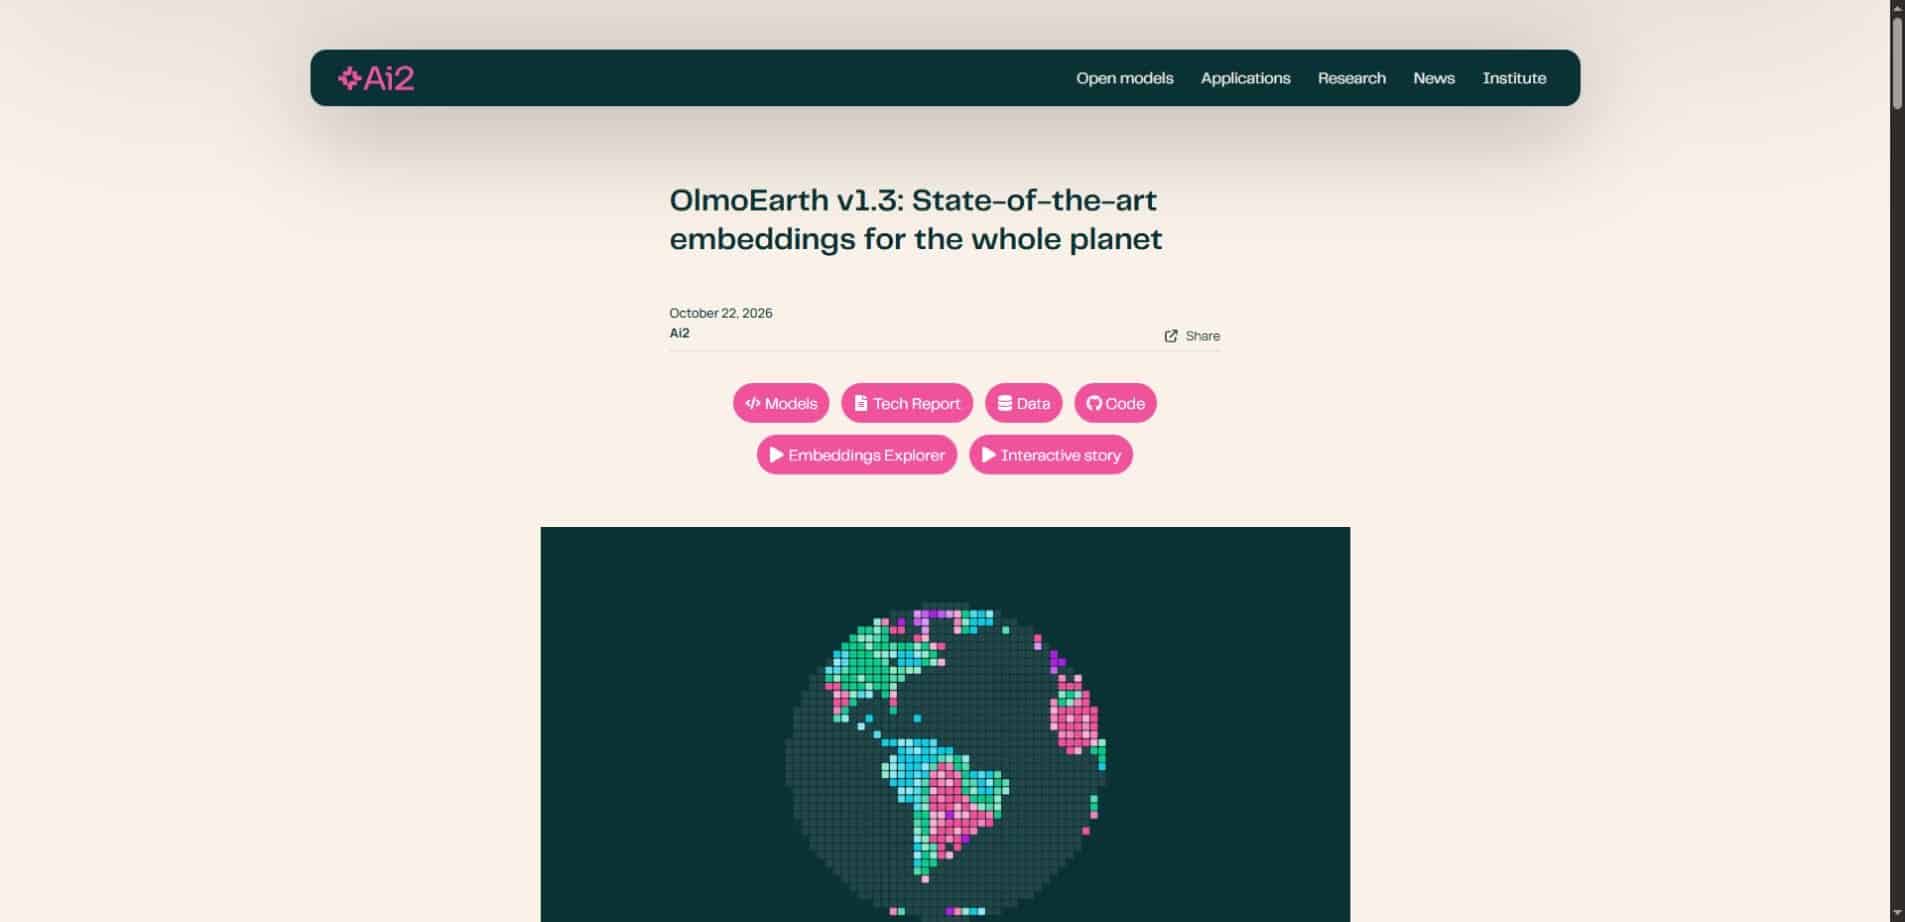
OlmoEarth v1.3, released by Ai2 on October 22, 2026, makes this kind of investigation more accessible. The release combines a satellite embedding model, precomputed annual representations and a browser-based explorer. Its value is in helping people find patterns worth checking, rather than turning every colored patch into a verified explanation.
This guide starts with the decisions a reader might make from a map, then explains the model underneath. We reviewed the official announcement and model information; we did not run an independent mapping benchmark.
Choose the question before choosing the map
A conservation team may want to find places resembling a known habitat. A local researcher may want to compare a landscape across years. An agricultural organization may want to distinguish land-cover categories. These questions require different evidence even when they begin with the same satellite data.
Write the question in a form that could be checked. “Find interesting changes” is useful for exploration, but “identify areas where a particular land-cover class changed between two available annual datasets” is easier to evaluate. A clear question also makes it easier to notice when a visualization is answering something else.
The central limit: an embedding is a numerical representation learned from data. Similarity, a predicted class and a change signal are three different outputs. None automatically establishes the cause of an event, its exact date or its legal status.
What Ai2 actually released
The official OlmoEarth v1.3 announcement describes annual embeddings at 10-meter resolution, available in 128-dimensional and lighter 64-dimensional forms. Inputs include Sentinel-1 radar and Sentinel-2 and Landsat multispectral time series. The explorer offers similarity search, classification and comparisons across years.
The release also includes model weights and development resources. That matters because users can begin with ready-made representations rather than train a large foundation model for every question. It does not eliminate the need for task-specific labels, validation or knowledge of the landscape.
Three investigations, with three different stopping points
1. Find other places that look similar to a reference area
Similarity search begins with a place of interest and asks where the learned representation is similar. For example, a researcher could use a known landscape as a starting point for locating candidate sites to inspect. This is an exploratory use, not a guarantee that the same species, crop or activity exists at every match.
Two places can share a remote-sensing pattern for different reasons. The useful next step is to inspect underlying imagery and relevant local information. A similarity result can narrow the search, while field evidence or a validated dataset establishes whether the match matters to the actual project.
2. Classify an area using examples
Classification assigns categories defined by the analyst. Good labels are therefore essential. If a person labels a mixed patch as pure forest or chooses examples from only one small corner, a model may learn a misleading distinction.
An illustrative land-cover exercise might separate water, dense vegetation and built surfaces. Before trusting the output, reserve examples that were not used to fit the classifier. Check difficult boundaries, mixed pixels and locations far from the training labels. This suggested workflow is not a report of a test we performed in the explorer.
3. Compare years to locate change
A change map can highlight where a representation differs between two periods. It is a useful way to prioritize inspection, especially when an area is too large to examine manually at full detail. But a difference alone does not identify its cause.
Changes in vegetation, land use, water conditions and the observations available to the model can complicate interpretation. Compare source imagery and investigate alternative explanations before describing a signal as a particular event. Annual summaries also should not be presented as live monitoring.
How the numbers underneath become useful
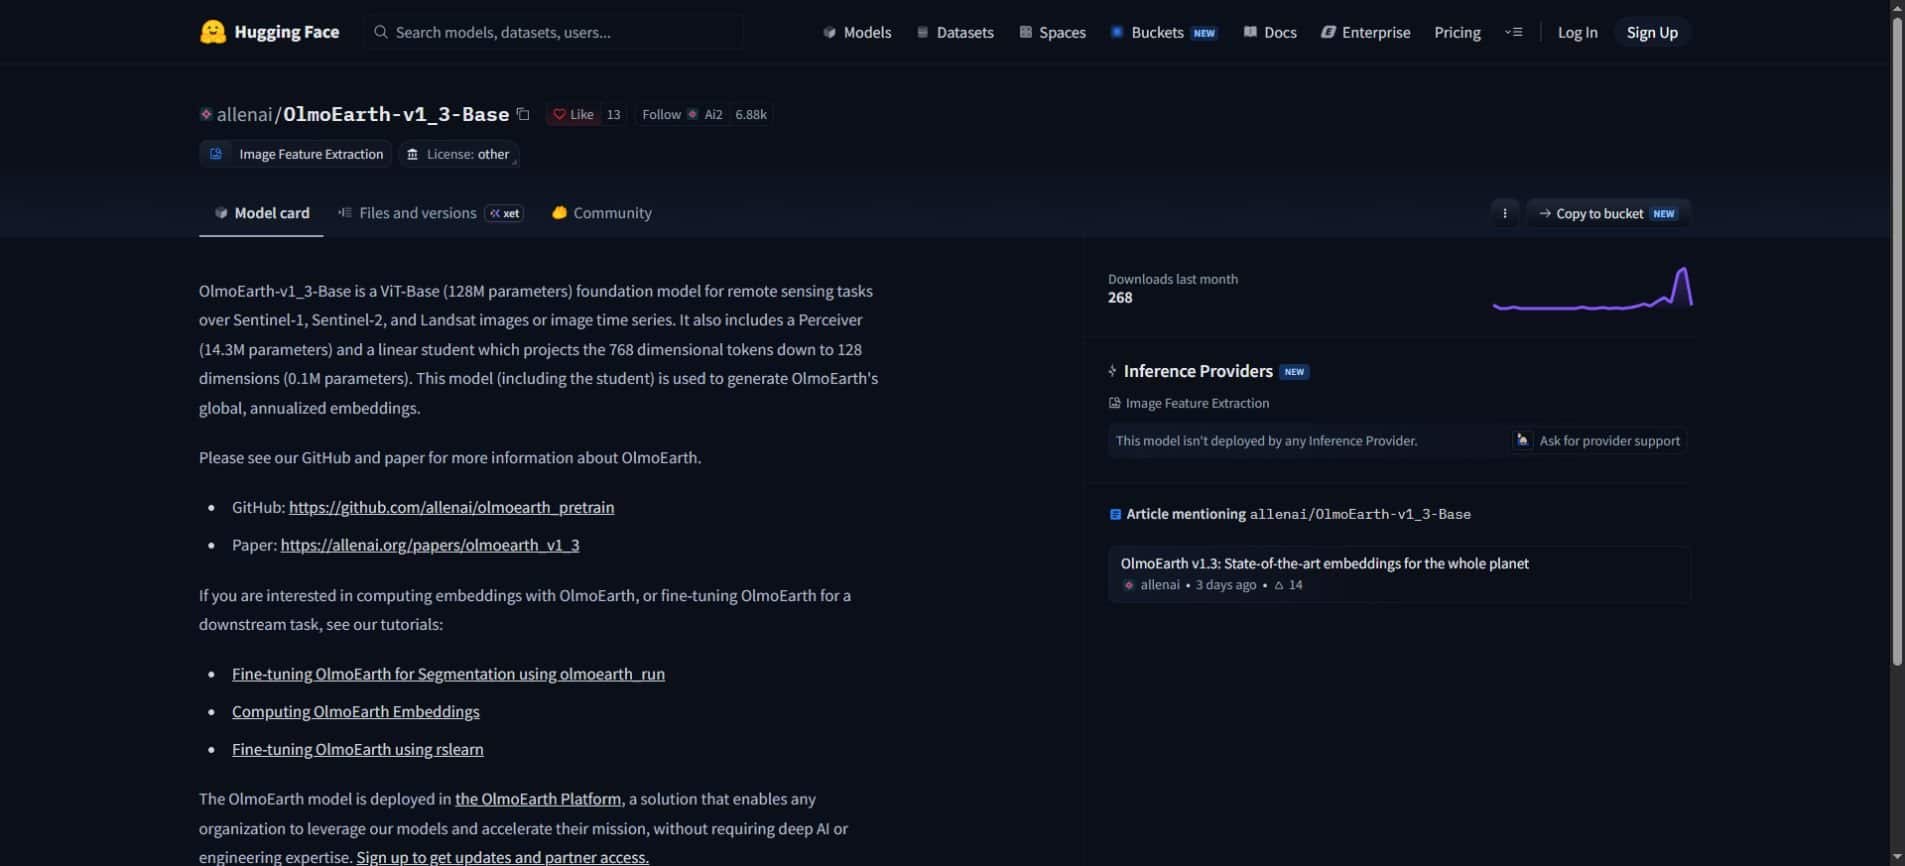
The official model card describes a vision-transformer foundation model for remote sensing, with additional components that create compact representations. These embeddings summarize information that downstream tools can reuse. They are not ordinary RGB photographs and their dimensions are not a ready-made list of human labels.
A useful analogy is a compact index for a large library. The index helps retrieve and compare material efficiently, but it is not the underlying collection itself. Similarly, a satellite embedding can support analysis without preserving every detail that someone might later need to inspect.
A false-color view makes patterns in these representations visible. The colors do not necessarily mean “forest,” “fire” or “urban” unless an explicitly defined analysis assigns such meanings. Read the legend and the task description before giving a color a real-world interpretation.
What 10-meter resolution does—and does not—mean
A 10-meter grid cell covers an area roughly ten meters by ten meters. It can include several surface types: a narrow road, a tree canopy, a building edge and bare ground. Grid spacing alone does not make every object inside the cell separately identifiable.
It also does not establish the accuracy of a classification. Spatial resolution, the frequency and timing of observations, model representation and task performance describe different properties. A map can have fine-looking detail while still making systematic mistakes for a particular category.
| What you see | What it can support | What still needs checking |
|---|---|---|
| Similar embedding patterns | A list of candidate locations | Whether the same ground condition is present |
| A predicted land-cover class | A task-specific mapping hypothesis | Errors on independent reference examples |
| A difference between annual layers | A place to investigate change | Cause, timing and source observations |
| A detailed 10-meter grid | Spatially organized information | Mixed pixels and category-level reliability |
Before downloading data, check these practical details
Coverage should be checked for the exact year and area of interest. At launch, Ai2 reports global coverage for 2023–2025, with earlier years available for selected countries. That is different from assuming every location has a complete nine-year history.
Licensing also deserves a separate check. The OlmoEarth Artifact License governs the model artifacts. A web platform can have its own usage agreement as well. Publicly accessible weights or a no-sign-in interface should not be interpreted as unrestricted permission for every use.
During our visit, opening an explorer example prompted a platform usage agreement. We did not accept it or run the example. Readers can review current access information at the OlmoEarth Embeddings Explorer before deciding whether it suits their intended work.
For developers, the linked embedding computation tutorial is a more relevant starting point than assuming the browser interface exposes every option. Storage, compute, input preparation and downstream evaluation still need to match the project.
A first-project plan that keeps claims manageable
- Choose one small area and one question that has a checkable answer.
- Confirm the required years and input coverage before comparing layers.
- Inspect reference imagery and record where labels came from.
- Keep some reference examples separate from classifier fitting.
- Review errors and uncertain areas, not only attractive map regions.
- Describe the result with its date range, method and limitations.
The reporting language should match the evidence. “These locations have similar representations” is different from “these locations contain the same habitat.” “This area changed between annual layers” is different from “this activity caused the change in a specific month.”
A map that helps choose the next investigation can be useful without supporting a final conclusion. That distinction is especially important when a result could affect landowners, communities or public decisions. Use additional evidence appropriate to the consequence of the claim.
Questions worth asking about any satellite AI result
Can I replace field knowledge with an embedding model?
No. Remote-sensing patterns are evidence about observations of the surface. Local knowledge, reliable reference data and appropriate domain expertise help determine what those patterns mean. They can also reveal errors that look plausible from above.
Does a stronger benchmark result guarantee my map will be better?
No. A benchmark evaluates specified tasks, datasets and metrics. The useful test is whether the method works for your region, category definitions and intended use. Keep independent examples and inspect failures before scaling an analysis.
Is this the same kind of embedding used in text search?
The broad idea is related: represent complex input numerically so software can compare or reuse it. The input data and learned relationships are different. Satellite embeddings should be evaluated for geospatial tasks rather than assumed to behave like a text-search model.
The most valuable output may be the next question
OlmoEarth v1.3 is part of a broader shift toward reusable AI representations. For users, the practical opportunity is to explore a question before committing to a larger mapping pipeline. The important discipline is to keep the representation, the model prediction and the real-world conclusion separate.
Our Small AI guide looks at practical tools shaped around local needs. Our article on AI overreliance explains why review remains part of useful AI work. Both ideas apply here: begin with a real question, and keep enough evidence to challenge the answer.
Follow the official release resources for technical updates, and compare wider AI news coverage with the source material. A compelling map is a starting point for investigation; a well-supported explanation requires more.
Reviewed October 25, 2026. This article draws on Ai2’s October 22 release and official model resources. The project plan and interpretive examples are editorial guidance. We have not independently validated the model’s performance or run a full explorer analysis.